
DH125
Group 3
The Growing Digital Divide
Keri Chen, Helen Wang, Hanna Co, Laura Lu, and Faizah Mohamed


1. Project Description and Rationale
Utilities like running water and electric grid connection were not always public utilities; they were once controlled by private companies that only connected those who could afford it (Wallace Jr.). As the United States recognized these utilities as essential and began transforming these services into public goods, access to running water, sewage systems, and connection to electric grids increased dramatically for poor and rural households across the US, leading to a dramatic increase in the health, education, and economic mobility outcomes of these regions. (Wallace Jr.)
We argue that the Internet has become as much of a necessity as traditional utilities, especially as remote work and schooling has grown. There has been a dramatic increase in the number of people that work remotely. As of 2022, 26% of Americans work remotely compared to the 5% of Americans that worked remotely in 2018 (Flynn). Although remote work is more convenient and many argue that employees are more productive working remotely, remote work can in part widen the wealth gap. Globally, those who work remotely are paid on average $3,000 more than someone who works in person (Thier). Remote work opportunities, and consequently higher wages, favor those with access to high speed internet.
We are interested in diving deeper into the relationship between internet access and the wealth gap. We wanted to investigate the question of whether or not there is a correlation between income levels and internet access, as well as other determining factors of income levels such as the distribution of white individuals’ access to the internet as compared to that of people of color. We also wanted to investigate the role that the internet plays in one's ability to be employed or seek higher level education. Overall, we wanted to gain a deeper understanding about the factors that contribute to communities’ internet access and how it can affect the lifetime development of individuals in order to advocate for the internet as a public good.
2. Significance
In this research project, we investigate the wealth gap between areas with high-speed internet access and areas without internet access, as well as how factors such as education levels and race distribution play into it. We hope that our research will spur policy makers and employers to prioritize increasing internet access in areas that may be left behind in the remote work revolution through community-led efforts. It’s not only possible, but it’s working — Chattanooga, Tennessee, “has offered public broadband via its municipal power organization, [since 2010]. At half the price, its service is … 85 percent faster than that of Comcast. Coupled with a

discounted program for low-income residents, Chattanooga’s publicly run broadband reaches about 82,000 residents—more than half of the area’s Internet users.” (Mint Press) Following their success, more than 450 communities nationwide have introduced publicly-owned broadband (Mint Press). We hope that our project will encourage this movement to grow.
Inadequate and unequal access to necessary resources has historically contributed to poor health, education, and financial outcomes; these have in turn trapped various communities in cycles of disenfranchisement. Much like electricity and indoor plumbing, high speed internet access is a utility that now plays a defining role in economic outcomes. As the internet becomes essential in all aspects of personal and professional life, it is important to identify its ties to the factors that conventionally impact economic mobility and prevent internet access from further widening the societal wealth disparity. Currently, the internet is privatized, with Internet Service Providers (ISPs) “selling broadband to discrete geographic regions with little overlap… They have immense power to manipulate speeds and charge prohibitively expensive rates. Such profiteering tactics have disproportionately affected low-income and rural communities… a problem plaguing users of color most acutely.” (Mint Press)
3. Audience
The key audience that we hope will benefit from our research are policymakers, especially those working in internet regulatory committees. Policymakers are essential to bridging the digital divide. We aim to remind them of the urgency and the significance of allocating the national services budget to reaching communities without high speed internet connection. In particular, policymakers can make additional spectrums available in rural areas and provide discounts on broadband services for low income communities. Here, we explore the discrepancy in access between low income and high income communities to help policymakers narrow down which communities to focus on. Additionally, individuals who are trying to advocate for equal access to the Internet, or are trying to find factors that contribute to one's social or financial status may find this project to be of benefit as well. Our project allows them to understand how access to the Internet may play a role in determining the opportunities available to someone, and how that eventually affects their income and, consequently, their living circumstances overall. We also aim to reach individuals with the means to afford internet access themselves in order to educate them on the realities of internet access and quality of life for those who are less fortunate.

4. Technical Specifications
For our project, we chose to use R to both analyze and visualize most of our data, because of the flexibility it allows in data analysis and manipulation. We also used Tableau to create one of the maps below. However, we predominantly relied on R because creating them in R allows us to perform significance tests or draw relationships between variables at the same time. Another reason we chose R over Google Sheets or Excel was because many members of our team had more programming experience, making it easier to manipulate data using code rather than Excel functions.

5. Data Selection
In 2013, the U.S Census Bureau began asking about internet use in the American Community Survey as part of improving broadband access across the country, and would publish a one-year estimate each year based on the results. Our data set, “Internet Usage across the United States”, is taken from 2016’s published estimate and contains 821 data points of counties with a population size of over 65,000. It measures demographic information, education level, median household information, median age of population and median rent per income. We chose this year because it provided sufficient data for us to be able to gather enough insight into internet use across the country and was the most recent, comprehensive dataset we found; since technology is constantly changing, we thought that the timeliness of the data was important. Furthermore, this dataset has been downloaded over 800 times, thus there was more reliability in this dataset compared to other datasets of later years. When going through our data, we particularly looked into economic information like median income and poverty rates, various internet access rates, and demographic information to focus on our main question of internet access and wealth gap and to keep in mind the racial and educational factors that traditionally indicate disenfranchised communities.
6. Analytical Approaches
6.1. Independence Test
For our project, we chose to use R to both analyze and visualize most of our data, because of the flexibility it allows in data analysis and manipulation. We also used Tableau to create one of the maps below. However, we predominantly relied on R because creating them in R allows us to perform significance tests or draw relationships between variables at the same time. Another reason we chose R over Google Sheets or Excel was because many members of our team had more programming experience, making it easier to manipulate data using code rather than Excel functions.
6.2. Confidence Intervals and Significance Test
We were also interested in investigating whether there were any trends geographically regarding internet access. It was important for us to address this factor to better guide changemakers towards determining criteria for which communities to prioritize. Since our dataset contained 821 different counties and there was an uneven ratio of counties in each state, we decided to segment our dataset into West Coast and East Coast. A county was considered to be on the East Coast if its longitude was less than 90 and it would be considered to be on the West Coast if its longitude was greater than 90. Specifically, we were interested in testing whether there is statistical evidence that the true mean of the East Coast’s sample is equal to the true mean of the West Coast’s sample when looking at the percent of people with no internet. We conducted a two-sample pooled t-test to find if there is a difference between the two populations. We used the pooled test because we assumed that there is equal variance between the two coasts.
We defined our hypotheses as below:
H0 = The true population means that the percent of people without internet on the West Coast and the percent of people without internet on the East Coast are equal: μ1 - μ2 = 0.
Ha = The percentage of people without internet on the East Coast is different from the percentage of people without internet on the West Coast: μ1 - μ2 ≠ 0.
6.3. Descriptive Statistics:
Income & Internet Access
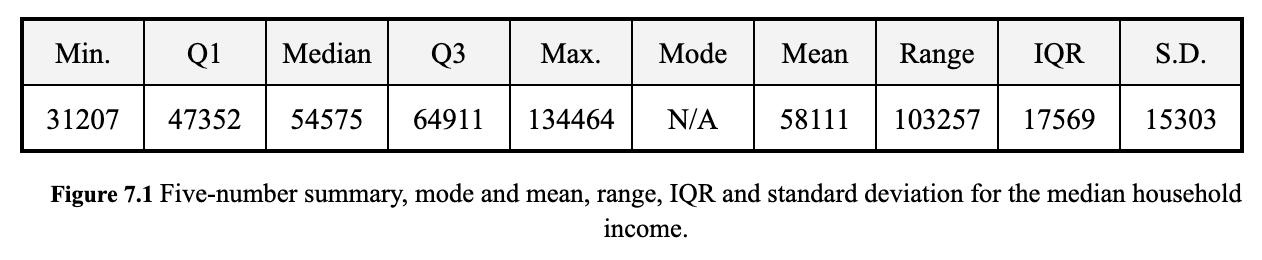
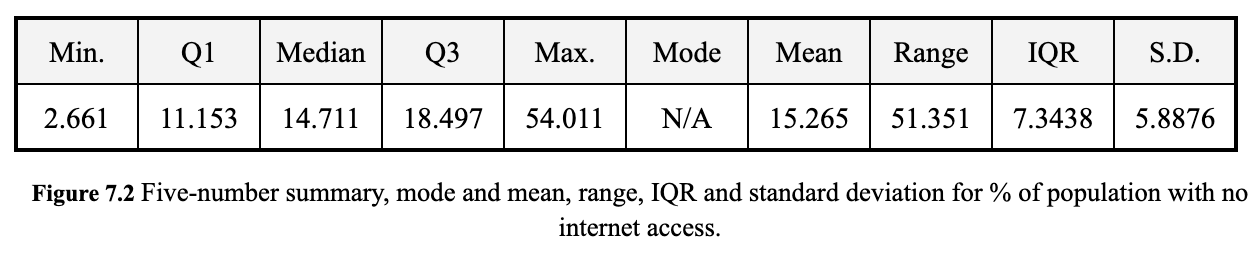
We also calculated the mode and mean, range, IQR and standard deviation for the median household income and households with no internet in order to get a better sense of our data and to begin identifying patterns.
Summary statistics for the median household income help us better define "low-income" and "high-income" communities in our household. The average of the median household income is $58,111, and the median of these values is $54,575. The lowest median household income data point we have is $31,207 and the highest is $134,464, giving us a range in between of $103,257. To give us an even clearer picture, an income of $47,352 is in the 25th percentile, and the 75th percentile is $64,911. The large jump in median household income between the 75th percentile and maximum indicates that the maximum median household income may be an outlier. The maximum is almost 4 standard deviations above the 75th percentile, and nearly 6 standard deviations above the median. Thus, our data set shows that there is a huge disparity in wealth across America with many unusually high income households that are pulling up the data.
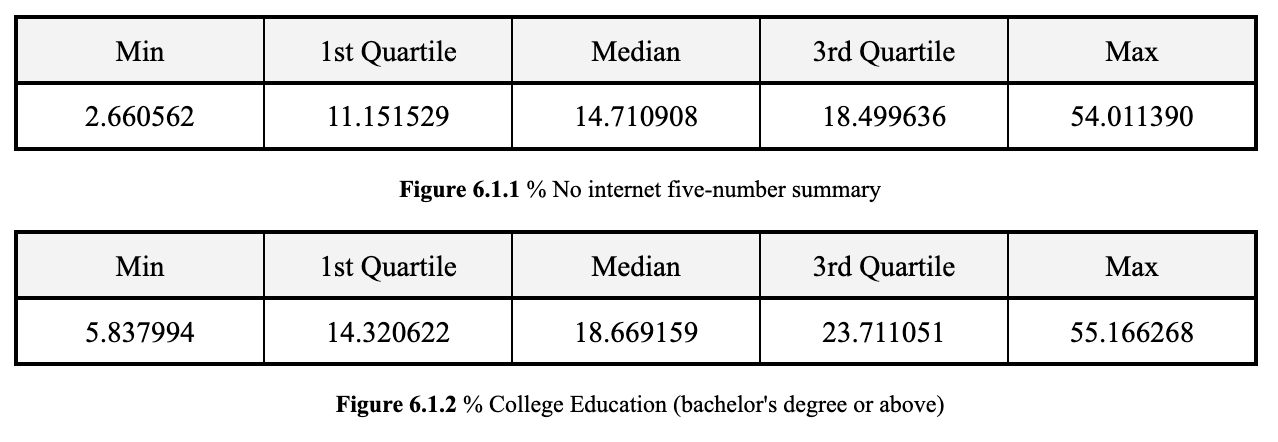
Since we are interested in investigating the relationship between internet access and economic mobility, a key feature of our data set that is important to our research is the percentage of households without internet access. From the dataset, the mean and median values for this are 15.265% and 14.711% respectively. The range of percentage of households without internet access is 51.351%, with our low and high values being 2.661% and 54.011%. As with the median household income feature, the maximum is about 6 standard deviations above the median, whereas the minimum is only about 2 standard deviations below the median. We can infer that, again, these areas with a high number of households without internet access are likely outliers within our dataset. However, although outliers are generally ignored in statistical analyses, the outliers are actually points of interest in our case as looking into these areas could provide a key insight. In a country as developed as America, why are there still areas where most households do not have access to the internet? What factors affect their access to the internet? Is it simply a matter of choice influenced by lifestyle and cultural practices, or are there systemic issues at play causing such inequities? There is a wide range in internet availability, from areas where almost everyone has internet access to areas where half of the population does not. This variability is expected, of course, but it is worth examining the outliers to get more insight into possible issues that policymakers must advocate solutions for in order to bring at least a baseline level of internet accessibility throughout the United States.
Findings
7.1. Internet Access and Education
After conducting the Chi Square Test explained in Section 6.1, we ran a Chi Square Test of independence to see whether or not attaining college level education and internet access were independent of one another. The p value was less than 2.2e-16 which is an extremely small p value. This leads us to reject the null hypothesis that the two variables are unrelated and thus that there is a strong relationship between one’s access to the internet and whether or not they receive a college education.
In the context of our research question, education is a major factor influencing one's economic status. This makes sense from a broader viewpoint because the level of education that people receive is often correlated with the advantages and resources their environment affords them; internet access can be considered one of those resources. The results of the chi squared test show that there is a strong relationship between one’s access to internet and the education they can receive, leading to further questions about whether internet access is a barrier to education and thus the lack of it prevents higher education, or whether college education is more likely in privileged areas with access to resources and thus a signal of disconnected, disadvantaged communities.
7.2. Internet Access and Income
Since we want to investigate the relationship between internet access and economic prosperity, we looked into two characteristics to identify affluence: the percentage of the population below the poverty level and median household income. The first characteristic gives us a view of how many individuals are struggling in each county, on average, and the second gives further information by household, according to the median household income. Analyzing both was useful in order to confirm our observations, especially since averages are more susceptible to outliers than medians.
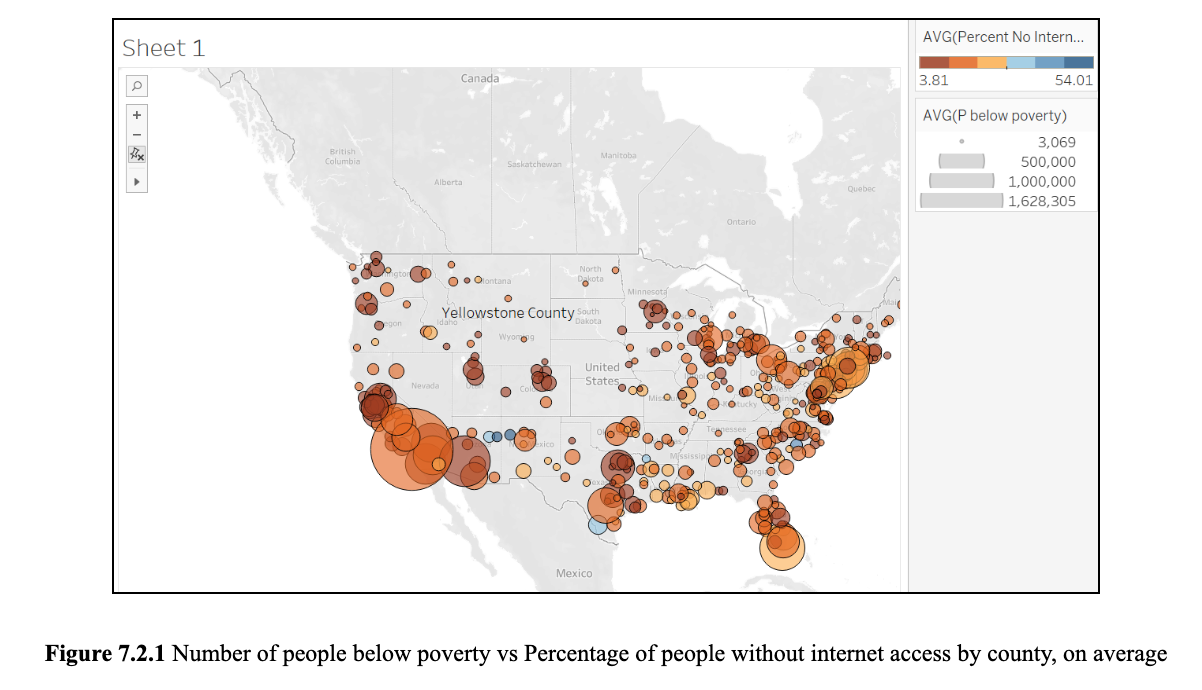
The first figure above is a map showing the average number of people below the poverty line compared with the average percentage of people without internet access per county. Each dot in the map represents a county in the dataset; the color of the dot shows the average percentage of internet access and the size represents how many people are below the poverty line, where a larger dot means more people are below poverty. From the map, we see a slight pattern between a county's poverty level and its percentage of people without the internet. Larger dots tend to be lighter in color or orange more often than the smaller dots are. The opposite also seems to be true, where many small dots are dark red, meaning that those areas have majority residents above the poverty line and with internet access. The results suggest a correlation between poverty and lack of internet access, where areas of greater poverty have less internet access and vice versa.
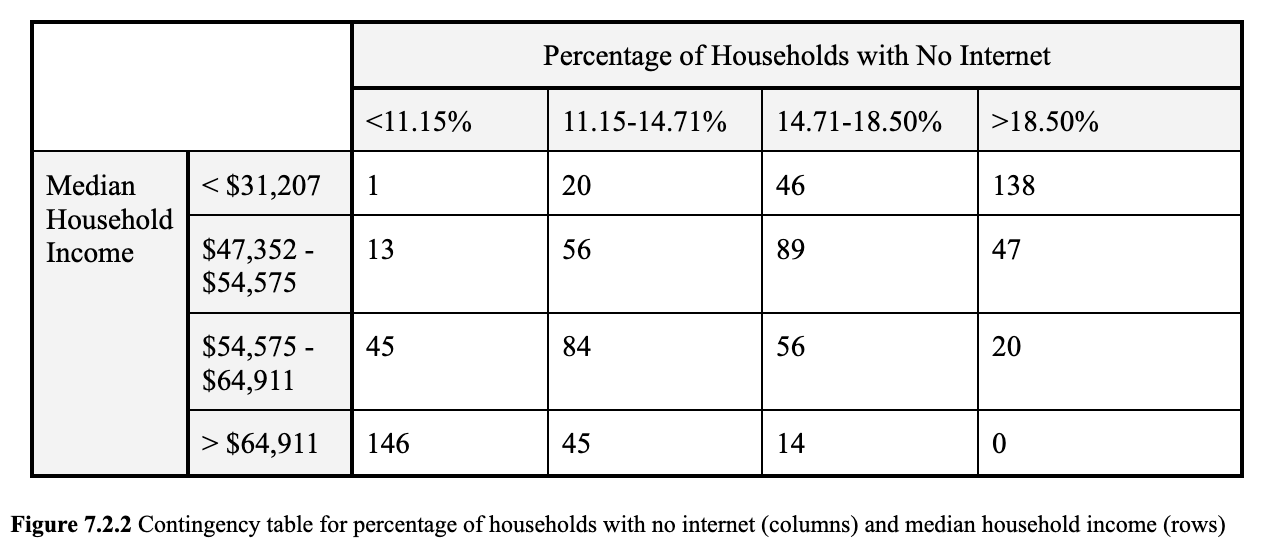
The second figure is a contingency table looking at different categories of internet access compared to median household incomes. To create the contingency table, we looked at the data for median household income and internet access and divided them into categories based on the quartiles. We see again that wealth and internet access are positively related. As the median household increases, the percentage of households without internet access decreases. For instance, the highest income bracket “greater than $64,9111” has 146 counties in the highest access bracket, “less than 11.53%” without, and 0 counties in the worst access bracket, “greater than 18.497%”. In contrast, the lowest income bracket has 1 county in the best access bracket and 138 in the worst access bracket. The number of counties in each household income is similar, so there is clearly a disparity in household access rates where counties with higher median income are less likely to lack internet access. The contingency table shows the relationship more stark than the map and confirms our findings that those who face economic barriers also face barriers to internet access.
7.3. Internet Access and Location
After conducting the two-sample pooled t-test described in Section 6.2, the p-value was 0.1743. This was greater than our ɑ value of 0.05. Therefore, we have evidence to suggest that we can accept the null hypothesis of no noticeable difference in internet access between East and West Coast, with reasonable confidence. This is further supported by the confidence interval values. There seems to be no statistically significant difference in the mean of both groups as the confidence interval includes the null value of zero. The lower bound and upper bounds for the confidence interval are -0.27 and 1.53, respectively. These figures tell us that we can be 95% confident that the difference between the mean number of people without internet in the East Coast compared to the West Coast is somewhere between -0.27 and 1.53. Thus, geographical location across the United States is not as strong of a predictor of internet access compared to income. We can instead direct more of our attention and resources towards minimizing the wealth gap in lower income communities and consequently the digital divide that exists within it.
Conclusion
The wealth gap is in part widening due to the lack of internet access. Using 800+ data points of counties across the United States, we explored factors affecting lack of internet access to draw attention to the communities most in need of high speed internet. In our paper, we conducted a chi-square test to discover there was a strong correlation between internet access and education levels. A lack of internet access can limit one’s ability to achieve economic mobility through higher level education. Educational opportunity and internet access both are strongly connected to income levels. The number of counties in each household income is similar, so through our contingency table, we identified that there is clearly a disparity in household access rates where counties with higher median income are less likely to lack internet access.
Ultimately, our findings corroborate established research on internet availability patterns across the US as they correlate with income, education, and geographic location. In the future, we hope that this information may be useful to policymakers in determining whether or not to increase regulations and public-private partnerships with existing telecommunications companies, and spur localities to push for their own publicly-owned broadband solutions given the growth it can bring to their communities.